Confusing parts on the Jeppesen textbook

piccolo789

Filing Flight Plan
Joined
Nov 27, 2025
Messages
4
Display Name
piccolo789
I am learning using the Jeppesen textbook, but some figures are unclear and lack explanations.

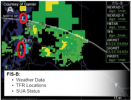
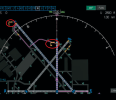
Fig 1: What do the yellow letters and what does that mean and its following digits?
Fig 2: What is the meaning of the green and shallow blue downward arrows?
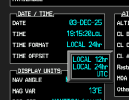
Fig 3: What does “LCL” mean?
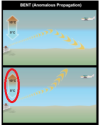
Fig 4: Should the 10° exchange with 5° in the bottom fig?
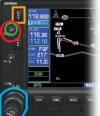
Fig 5: What are the words marked by the green circle?
 

Attachments

  • 1.png
    1.png
    441.3 KB · Views: 39
  • 2.png
    2.png
    122.1 KB · Views: 41
  • 3.png
    3.png
    66.9 KB · Views: 35
  • 4.png
    4.png
    45.7 KB · Views: 33
  • 5.png
    5.png
    98.9 KB · Views: 42
Picture 5 is a poor rendition of a Garmin 530. The knob you have circled just has a C on it and it is the volume control for the comm radio embedded in that device.
 
The first one looks like the ADSB return from two UAL airliners. The zero is their speed and the numbers on the bottom are the GPS altitude.
 
It's hard to tell based on the photos without also having the book

#1. I can't tell without knowing what display is being emulated.
#2. Those vertical flags indicate that the weather station is reporting a METAR. Blue indicates marginal VFR; green VFR.
#3 is the area where the current time is shown on a G1000. "LCL" means its set to local time rather than Zulu.
#4. No, it's correct. It's depicting a temperature inversion.
#5. Ron covered it. The on off/volume control knob for the GNS 530
 
The first one looks like the ADSB return from two UAL airliners. The zero is their speed and the numbers on the bottom are the GPS altitude.
I think you're right. It appears to be an ATC ground radar display.
 
It's hard to tell based on the photos without also having the book

#1. I can't tell without knowing what display is being emulated.
#2. Those vertical flags indicate that the weather station is reporting a METAR. Blue indicates marginal VFR; green VFR.
#3 is the area where the current time is shown on a G1000. "LCL" means its set to local time rather than Zulu.
#4. No, it's correct. It's depicting a temperature inversion.
#5. Ron covered it. The on off/volume control knob for the GNS 530
I’m still confused about #4. The top figure bends down and the bottom figure bends up. Both are also temperature inversion. But AI said the bottom one shouldn’t temperature inversion based on the logic.
 
I’m still confused about #4. The top figure bends down and the bottom figure bends up. Both are also temperature inversion. But AI said the bottom one shouldn’t temperature inversion based on the logic.
All I’m saying is that the temperature numbers you circled represent an inversion. I still have no idea what the Jepp book is trying to show.

Aside from that, be careful with AI in the aviation space. All AI does is collect information and pass it on. That means collecting from both official and scholarly sources and social media group posts. it’s not judging validity (although it sometimes sounds like it is). Hang around in aviation social media long enough and you’ll realize there are far more incorrect answers than correct ones for AI to select. I regular ask AI questions about information see a lot of simply wrong answers,
 
Figure #4 need some context. It could be something to do with communication:
“Temperature inversions, where a layer of warm air is trapped between layers of cooler air, can create unique propagation conditions. These inversions can lead to tropospheric ducting, where radio waves are trapped and guided over long distances. While this can enhance communication range, it can also lead to interference from distant signals.”
 
Fig 1 yellow letters are Airway IDs, digits are altitude limits. Fig 2 green/blue arrows: likely weather radar reflectivity or turbulence layers, they show precipitation levels. Fig 3 LCL is Lifted Condensation Level (cloud base). Fig 4 is definitely a printing mistake, swap the 10 and 5. Fig 5 words are just the labels for altimeter setting and frequency
 
Fig 1 yellow letters are Airway IDs, digits are altitude limits. Fig 2 green/blue arrows: likely weather radar reflectivity or turbulence layers, they show precipitation levels. Fig 3 LCL is Lifted Condensation Level (cloud base). Fig 4 is definitely a printing mistake, swap the 10 and 5. Fig 5 words are just the labels for altimeter setting and frequency
Interesting take. You really have me scratching my head how you came up with "lifted condensation level" for #3 ? I've never seen that displayed anywhere in a G1000, let alone in the current time box on a G1000 PFD. It's one of three time display options you can set on the MFD.

1764789355218.png
 
Last edited:
Back
Top