You are using an out of date browser. It may not display this or other websites correctly.
You should upgrade or use an alternative browser.
You should upgrade or use an alternative browser.
Electronic engine performance calculator?
- Thread starter 455 Bravo Uniform
- Start date
ateamer
Pattern Altitude
I use the AircraftPower app. Easy to use, accurate.
- Joined
- Dec 5, 2010
- Messages
- 5,607
- Display Name
Display name:
GeorgeC
previously
I'm looking for more precise calculated cruise power settings for my 310L, above and beyond the power settings shown in the POH. For my year 310, the POH does not take into account OAT and PA. I know newer model's POH (ie. 310R) have the cruise charts broken out for various temp and PA, and all of my previous military flying included computer-based Performance Planning Cards (PPC) completed before each flight, yielding calculated cruise power settings based on actual conditions.
The POH references using the "Cessna 310 Power Computer" for more precise cruise power settings, however the...
The POH references using the "Cessna 310 Power Computer" for more precise cruise power settings, however the...
- kep5niner
- Replies: 16
- Forum: Flight Following
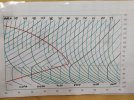
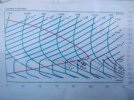
I use this power-air-fuel graph and TAS chart all the time for my 200 HP Mooney with IO-360 Lycoming. The MR variable is Manifold Pressure plus RPM in hundreds. 20 manifold pressure plus 2500 RPM becomes 20 + 25 = 45. The 45 constant air flow line intersects the 8 GPH constant fuel flow line in the center of the best economy portion of the fuel line, at about 60% power. I used 15 HP/gallon at 60% power as the basis for the graph. My calculations indicated this is reasonable for my engine after looking over the data from Lycoming and my Mooney POH.
hope this helps.
Edit: the best economy fuel curves line up at 60% and 75% power perfectly. This graph can be adapted to any NA engine by simply renumbering the gph curves.
hope this helps.
Edit: the best economy fuel curves line up at 60% and 75% power perfectly. This graph can be adapted to any NA engine by simply renumbering the gph curves.
Attachments
Last edited:
- Joined
- Sep 11, 2019
- Messages
- 2,178
- Display Name
Display name:
Domenick
Couldn't find the app on Google Play or Apple Apps. Where is it?I use the AircraftPower app. Easy to use, accurate.
- Joined
- Apr 18, 2013
- Messages
- 4,395
- Location
- Live from the Grill-o-mat
- Display Name
Display name:
Mantis Toboggan, MD
Couldn't find the app on Google Play or Apple Apps. Where is it?
AircraftPower
AircraftPower is an Aircraft Engine Performance App. It uses a standard reciprocating engine performance model to calculate and display the sea level and altitude performance of 74 normally-aspirated Continental® engines and 108 normally-aspirated Lycoming® engines. A graphic display shows...
apps.apple.com
Nauga,
underpowered
- Joined
- Apr 18, 2013
- Messages
- 4,395
- Location
- Live from the Grill-o-mat
- Display Name
Display name:
Mantis Toboggan, MD
- Joined
- Sep 11, 2019
- Messages
- 2,178
- Display Name
Display name:
Domenick
I downloaded it to my iPad. Seems like it has some issues.
For example, the O-320-D (there is no -D3G option) has a slider for Manifold Pressure. However, fixed-pitch prop planes like my Warrior have no manifold pressure gauges. Where should the slider be set?
For example, the O-320-D (there is no -D3G option) has a slider for Manifold Pressure. However, fixed-pitch prop planes like my Warrior have no manifold pressure gauges. Where should the slider be set?
- Joined
- Apr 18, 2013
- Messages
- 4,395
- Location
- Live from the Grill-o-mat
- Display Name
Display name:
Mantis Toboggan, MD
I don't think it's an issue as much a reflection of power dependencies. So...same way you use the % power tables in the Lycoming operator's handbook without manifold pressure, I suppose. Given that power is a function of manifold pressure and RPM (with other corrections), no manifold pressure measurement means you'll get a rough estimate of power at best.I downloaded it to my iPad. Seems like it has some issues.
For example, the O-320-D (there is no -D3G option) has a slider for Manifold Pressure. However, fixed-pitch prop planes like my Warrior have no manifold pressure gauges. Where should the slider be set?
If you're running LOP Lycoming also says you can estimate power using fuel flow, but I have neither fuel flow nor fuel injection so I know nothing more about it.
Nauga,
who has MAP on a fixed-pitch O-320D, mostly so he can estimate power.
- Joined
- Sep 11, 2019
- Messages
- 2,178
- Display Name
Display name:
Domenick
I've been continuing to play with the app. Still confused. The app appears to have little concept of independent vs. dependent variables.
This is how I would like to use it.
I want to fly across Washington State, from it's Pacific coast to the Idaho border, 300 nm. My altitude will be 7500 MSL which gets me over the Olympic Mts (if I avoid Mt. Olympus) and across the I-90 corridor over the Cascades. I'd like to tool along at 67% power.
Taking off from Quillayute (UIL) and bound for Coeur d'Alene, Idaho (COE), I climb to 7500 MSL, set % Rated Power to 67%, set altimeter setting, set Indicated Altitude, and OAT. What I want and expect is for the app to give me the RPM I need to attain 67% power given my settings. However, it does not do that. It simply sits there like a rock. Playing with the %power slider does not change my RPM, but does move the tiny chart. Playing with RPM does not change the %power, but it does move the tiny chart.
Seems worthless.
The easiest thing to do is add an analog manifold pressure gauge. Your AI should be able to put one in for you at your next annual for not too much money. Manifold pressure and RPM (corrected for air temperature) defines the airflow through the engine, which can be used to define power either either ROP or LOP. At cruise power, leaning to maximum airspeed for a given throttle setting defines ROP max power. Double check this TAS against the POH and you get HP produced by the engine. Continue leaning to drop about 3% TAS and you are LOP at about 94% of max power at the same throttle setting. Double check the change in TAS to get HP produced and GPH fuel consumed. My chart does most of the work for you once you have double checked against the POH a few times.I downloaded it to my iPad. Seems like it has some issues.
For example, the O-320-D (there is no -D3G option) has a slider for Manifold Pressure. However, fixed-pitch prop planes like my Warrior have no manifold pressure gauges. Where should the slider be set?
Attachments
Last edited:
Use the ASI instead and correct for TAS. Your POH will tell you what TAS you will make at 67% power at various altitudes.I've been continuing to play with the app. Still confused. The app appears to have little concept of independent vs. dependent variables.
This is how I would like to use it.
I want to fly across Washington State, from it's Pacific coast to the Idaho border, 300 nm. My altitude will be 7500 MSL which gets me over the Olympic Mts (if I avoid Mt. Olympus) and across the I-90 corridor over the Cascades. I'd like to tool along at 67% power.
Taking off from Quillayute (UIL) and bound for Coeur d'Alene, Idaho (COE), I climb to 7500 MSL, set % Rated Power to 67%, set altimeter setting, set Indicated Altitude, and OAT. What I want and expect is for the app to give me the RPM I need to attain 67% power given my settings. However, it does not do that. It simply sits there like a rock. Playing with the %power slider does not change my RPM, but does move the tiny chart. Playing with RPM does not change the %power, but it does move the tiny chart.
Seems worthless.
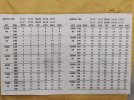
EDIT: I used to own a 1968 Cherokee 140. Here are the TAS charts I used for leaning ROP. These print on letter size 8.5 x 11 but the print is on half of that, so 8.5 x 5.5 after trimming. Print both, put them back to back, and you have detailed TAS from 2500 to 9500 feet. The chart TAS matches the Altimeter setting in BOLD. Move up or down a row or more for different altimeter settings. It didn't give me HP%, but it did give me GPH when leaned for ROP. I found it to be pretty accurate for all the flying I did with that airplane. It was pretty easy to use too, especially when bouncing around in the cockpit.
All you have to do is have a TAS in mind for 67% power and trim the airplane to fly at that TAS at Cruise altitude. Everything else falls into place automatically.
Attachments
Last edited:
- Joined
- Apr 18, 2013
- Messages
- 4,395
- Location
- Live from the Grill-o-mat
- Display Name
Display name:
Mantis Toboggan, MD
Oof, that's all messed up 
I'll repost when/if I can get my head out of my ***.
Nauga
in the dark
I'll repost when/if I can get my head out of my ***.
Nauga
in the dark
- Joined
- Apr 18, 2013
- Messages
- 4,395
- Location
- Live from the Grill-o-mat
- Display Name
Display name:
Mantis Toboggan, MD
How do you do this now?Taking off from Quillayute (UIL) and bound for Coeur d'Alene, Idaho (COE), I climb to 7500 MSL, set % Rated Power to 67%, set altimeter setting, set Indicated Altitude, and OAT. What I want and expect is for the app to give me the RPM I need to attain 67% power given my settings. However, it does not do that. It simply sits there like a rock. Playing with the %power slider does not change my RPM, but does move the tiny chart. Playing with RPM does not change the %power, but it does move the tiny chart.
Nauga,
no pressure
455 Bravo Uniform
Final Approach
- Joined
- Sep 11, 2019
- Messages
- 2,178
- Display Name
Display name:
Domenick
I get to 7500 MSL, set RPM to 2500, lean to roughness, then enrichen to smoothness. IAS is 105-110 kts. From the POH chart, depending on the lapse rate that's 65-70% power.How do you do this now?
Nauga,
no pressure
I know how to use the POH charts. I thought the idea of the app was to negate the need to use the POH charts. It does not do that. I'm not sure what it's doing.
- Joined
- Apr 18, 2013
- Messages
- 4,395
- Location
- Live from the Grill-o-mat
- Display Name
Display name:
Mantis Toboggan, MD
I apologize, I didn't mean to imply otherwise. I asm genuinely interested in how it's done for your airplane.I know how to use the POH charts.
Until today I hadn't looked at power charts for a FP airplane with no MP gauge in decades. I've just now looked at a couple and am reminded that they are airplane-specific. I agree the app doesn't have the flexibility to give you the RPM you need for the %power you want with without knowing the MP that will produce it, but also note that it would require data for individual airplane models, not just engine models. Power is a function of RPM and manifold pressure - if your charts don't use it as an input it's baked in there somewhere, specific to your model of airplane/engine/prop.
It does do that if you have a constant speed prop and MP gauge.I thought the idea of the app was to negate the need to use the POH charts. It does not do that.
The power charts in the app for the O-320D look *almost* exactly like the power charts in my POH, which coincidentally look *exactly* like the power charts in the Lycoming O-320 Series Operator's Manual (which was the source for them). I have a FP prop, but also an MP gauge, so I use them to get my power and %power and adjust RPM as necessary, letting MP fall out. My engine monitor also has a similar calculation which shows me %power in flight, but this would not be possible without MP.
Nauga,
whose mileage may vary
- Joined
- Sep 11, 2019
- Messages
- 2,178
- Display Name
Display name:
Domenick
I took no offense, so no need to apologize. I'm glad the app works for for some.I apologize, I didn't mean to imply otherwise. I asm genuinely interested in how it's done for your airplane. ...
App deleted.
Ed Haywood
En-Route
%HP is one of my favorite Engine Monitor features.
When I owned my Cherokee and flew it regularly for 14 years and 500+ hours, I concluded that power in a fixed pitch prop was a difficult thing to ascertain from RPM alone. Prop slip varies widely depending on a number of factors and determining power from RPM alone is not feasible. The most reliable method was stabilized cruise true airspeed at altitude. The POH defines a number of these at gross weight 2150 lbs and reduced weight of 1950 lbs. Another rule I used was loss of maximum power due to increasing altitude. The engine loses about 3% for every thousand feet of standard altitude. On a scientific calculator I used 0.97 raised to a power of 8.5 for 8500 feet, or 77.2% still available to climb. I then throttle back slightly and lean to max RPM. Based on the POH I had a cruise TAS at altitude in mind. I did it mostly to keep track of fuel burn after installing Knots 2 u wheel pants. I wrote an article about it for Air Facts Journal and included the TAS and fuel burn chart that I used.I apologize, I didn't mean to imply otherwise. I asm genuinely interested in how it's done for your airplane.
Until today I hadn't looked at power charts for a FP airplane with no MP gauge in decades. I've just now looked at a couple and am reminded that they are airplane-specific. I agree the app doesn't have the flexibility to give you the RPM you need for the %power you want with without knowing the MP that will produce it, but also note that it would require data for individual airplane models, not just engine models. Power is a function of RPM and manifold pressure - if your charts don't use it as an input it's baked in there somewhere, specific to your model of airplane/engine/prop.
It does do that if you have a constant speed prop and MP gauge.
The power charts in the app for the O-320D look *almost* exactly like the power charts in my POH, which coincidentally look *exactly* like the power charts in the Lycoming O-320 Series Operator's Manual (which was the source for them). I have a FP prop, but also an MP gauge, so I use them to get my power and %power and adjust RPM as necessary, letting MP fall out. My engine monitor also has a similar calculation which shows me %power in flight, but this would not be possible without MP.
Nauga,
whose mileage may vary

Knowing your true airspeed for fuel management : Air Facts Journal
I have a healthy fear of running out of fuel and I do everything I can to be sure there is fuel left in the tank when I land. One of the best improvements I made had nothing to do with the airplane at all, but instead was a cheat sheet for quickly finding True Airspeed to trim the airplane and...
Last edited:


