Skew T soundings usefullness

simtech

En-Route
Joined
Aug 15, 2012
Messages
3,089
Location
mississippi
Display Name

Display name:
Simtech
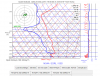
So I've started to dive into Skew t's..well I'm at the surface right now still trying to figure out what all it can tell me. But Ill start with the Temp and Dew point spread. I learned when they get close that is the base of the clouds and when they spread back out that is the tops. Cool right? But Skew T's are taken twice a day. Is that not just a snap shot in time and in which case how useful are they really wen trying to figure cloud bases and tops?
 
Wrong, wrong, wrong!!! RAOBs (balloon runs) are taken twice a day, and they are only once of the many data sources. The RUC part of rucsoundings is "Rapid Update Cycle." Does that sound like twice a day to you?

If you click on Op40 as the initial data source the data is taken hourly.

Go to www.avwxworkshops.com you will see lots of free information from Scott Dennstaedt and have the opportunity to sign up for his workshops. He sells a CD-ROM program specifically designed to teach the Skew-T.

The Skew-T is a far better source of winds and temperatures aloft than the FB that is used on knowledge exams.

Bob Gardner
 
Well apparently I was wrong. Thanks for the info and Ill check out the link. I was wondering how twice a day could be useful but I was unaware of the RUC. See that's why I asked to learn.
 
Well apparently I was wrong.

Bob certainly had a way with words to seduce you into accepting his point of view. It must have taken him seconds to decide on that masterful approach to guiding you towards enlightenment.
 
SkewT is also used by soaring pilots to predict thermal strength and top of usable lift in addition to cloud base and winds aloft.
 
I use them heavily when evaluating icing risk. They're not perfect but it's incredibly rare I see them differ by a significant amount from reality.
 
As Jesse saud, in the winter months, it helps with understanding icing potential. In the summer months, it helps with determining existence of potential convective activity. In all seasons, it can help choose an altitude in bright sunshine after passing through cloud layer on a dreary surface day.

Since I started using them, I've found the forecasts to be incredibly accurate.
 
Take Bob's advice and go to Www.avwxworkshops.com - take it even further and subscribe! not sure if Scott is doing anymore 1 on 1 training - but if he is it is WELL worth the money!
 
As Jesse saud, in the winter months, it helps with understanding icing potential. In the summer months, it helps with determining existence of potential convective activity. In all seasons, it can help choose an altitude in bright sunshine after passing through cloud layer on a dreary surface day.

Since I started using them, I've found the forecasts to be incredibly accurate.

Currently im trying to learn how to use it for convection. Being summer here in the southeast builds up happen rather quickly. So I'll keep reading and learning what I can. Thanks for the info!
 
SkewTs are incredibly useful. It just takes a few seconds to visualize temperature inversions, wind speed and direction, and cloud bases and tops. There's a lot of information all in one chart.

Honestly, I've never used the old-style winds aloft. SkewT charts are much easier.

Here's a good place to start:
https://avwxworkshops.com/magazines/Dennstaedt_Skew-T-Part1.pdf
https://avwxworkshops.com/magazines/Dennstaedt_Skew-T-Part2.pdf
https://avwxworkshops.com/magazines/Dennstaedt_Skew-T-Part3.pdf
 
Currently im trying to learn how to use it for convection. Being summer here in the southeast builds up happen rather quickly. So I'll keep reading and learning what I can. Thanks for the info!
Check out my Skew-T playlist. I didn't do the presentation; I just converted it to a YouTube-compatible video (with permission of the author).

It doesn't replace Scott's excellent programs and materials but it will give a pretty good overview of what it does and how.
 
SkewTs are incredibly useful. It just takes a few seconds to visualize temperature inversions, wind speed and direction, and cloud bases and tops. There's a lot of information all in one chart.

Honestly, I've never used the old-style winds aloft. SkewT charts are much easier.

Here's a good place to start:
https://avwxworkshops.com/magazines/Dennstaedt_Skew-T-Part1.pdf
https://avwxworkshops.com/magazines/Dennstaedt_Skew-T-Part2.pdf
https://avwxworkshops.com/magazines/Dennstaedt_Skew-T-Part3.pdf

I have read through these myself and have been comparing the SkewT found here:

https://skewt.meteor.com/

to the observed and PIREPS. The base and top reports from PIREPS are pretty much validating the info from the SkewT.
 
Currently im trying to learn how to use it for convection. Being summer here in the southeast builds up happen rather quickly. So I'll keep reading and learning what I can. Thanks for the info!

Senior moment. I forgot to suggest that you go to YouTube and search for Weather in the Vertical, by physicist/CFII Ed Williams.

Bob
 
I have read through these myself and have been comparing the SkewT found here:

https://skewt.meteor.com/

to the observed and PIREPS. The base and top reports from PIREPS are pretty much validating the info from the SkewT.

I just spot checked my current location. It says no clouds at any altitude, now. It's actually overcast and pretty dark.

For the record, KNUQ at 1800Z (i.e., 15 minutes ago).

rucsoundings shows clouds from 2100 to 2800 at 1800Z. ASOS says OVC029, so that's a slight bit off, too, but much closer.
 
Last edited:
I just spot checked my current location. It says no clouds at any altitude, now. It's actually overcast and pretty dark.

For the record, KNUQ at 1800Z (i.e., 15 minutes ago).

rucsoundings shows clouds from 2100 to 2800 at 1800Z. ASOS says OVC029, so that's a slight bit off, too, but much closer.

The rucsoundings.noaa.gov page definitely shows possibility of clouds between ~1000 and 3600 ft.

KNUQ metar reports OVC 2,900.

I don't think temp and dewpoint meeting indicates definitively there will be clouds at that level. The lines meeting indicate ideal conditions for clouds. Just as much, they don't have to meet on the SkewT for there to be clouds. Sometimes the temps are close, but there are clouds at that level.
 

Attachments

  • knuq skewt.png
    knuq skewt.png
    77.5 KB · Views: 24
The skew t became a lot more useful to me once I grokked the LCL.
 
The skew T diagram is like DOS 3. It is very useful, but an absolute dreadful user interface. It is no wonder that virtually only a handful of pilots use the data.

It is also similar to the performance section of jets. It is great information, but the pilots who fly everyday pay to have a computer decipher and present the data.

Until a "Bill Gates" comes along and creates a "Windows for Skew T," it will remain a postscript for weather depiction.

Quite frankly I don't see what's confusing about how it is presented? It takes me all about 5 minutes to teach someone how to get a great deal of value out of it.
 
Teach THIS in 5 minutes?

""""""Here's a good place to start:
https://avwxworkshops.com/magazines/...ew-T-Part1.pdf
https://avwxworkshops.com/magazines/...ew-T-Part2.pdf
https://avwxworkshops.com/magazines/...ew-T-Part3.pdf
"""""""""


Only Henning (who you should invite back) could learn that fast.

Scott obviously covers a lot more than you can cover in 5 minutes. But the basics of what the skew-t is, what it's limitations are, what data it shows you, and some value you can get out of it is easily covered in that time frame :)
 
Wrong, wrong, wrong!!! RAOBs (balloon runs) are taken twice a day, and they are only once of the many data sources. The RUC part of rucsoundings is "Rapid Update Cycle." Does that sound like twice a day to you?


Sheesh!

Try to relax, Bob!

Many people confuse forecasts with balloon observations. The data are presented as graphs that look similar. They also are labeled using obscure acronyms such as RUC that do not much help the novice to identify whether a graph is forecast vs observation.
 
Sheesh!

Try to relax, Bob!

Many people confuse forecasts with balloon observations. The data are presented as graphs that look similar. They also are labeled using obscure acronyms such as RUC that do not much help the novice to identify whether a graph is forecast vs observation.

I emphasized RUC for the OP because "rapid" and "twice a day" do not compute. The complete title for the Skew-T is http://rucsoundings.noaa.gov/. I cover the basics in THE COMPLETE PRIVATE PILOT and THE COMPLETE ADVANCED PILOT...nothing like what Scott and Ed put out, but enough information to make Skew-T usable.

IMHO balloon soundings are pretty much useless for the average pilot: too infrequent, too few reporting points. Back in the 1940s, when the Coast Guard manned weather stations in both oceans, I watched many a balloon run, and the amount of post-run analysis required before we could transmit the results back to the NWS was staggering.

Bob Gardner
 
Back
Top