I have been working on this idea for quite a long time, and I finally have a set of Fuel and Air curves that are easy to set up for your airplane and easy use in flight.
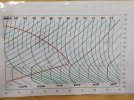
If you have studied ROP and LOP operations, then you may be familiar with the Red Box and the Red Fin concepts. The Red Box, and the area under the Red Fin, is defined as an area of higher engine stress to be avoided if possible. It occurred to me some time ago that not only can the Red Fin be graphed but so can curves of constant fuel flow and curves of constant air flow be superimposed on the same graph. I was able to graph the curves for my 1964 Mooney M20E and I have been using them to set my mixture since 2019. In 2020 I expanded the graph to give me more information for use during light cruising at reduced power and speed. I use this graph every time I fly, to make sure I am getting the best economy out of the fuel I am using. It is easy to use and with my bird having a Fuel Flow Meter, Manifold Pressure Gauge and Tachometer it makes setting up the engine for LOP operations a snap.
I have finally figured out how to make this set of curves applicable to any airplane equipped with any engine. All you need is your POH, and calculator and a pencil. Start by printing a color copy of "Red Fin Fuel Air Curves Scales" This is a blank set of curves with some instructions underneath. Start by following instruction 1. Determine LOP fuel GPH values using FORMULA: ( Rated HP / 15 ) x ( % / 100) = GPH -50℉ LOP for each % of load calculated. Calculate the LOP GPH values and fill in the blank lines over 75%, 71.25%, 67.5%, 63.75%, 60%, 56.25%, 52.5%, 48.75%, and 45%. Now fill in those values to the corresponding fuel curve above. Notice the BLACK Fuel Curves are vertical at 75%, 60% and 45% on the graph. Notice the bottom of each fuel curve is displaced to the right at the bottom end. The value for each Fuel Flow curve should be directly below the bottom end of each curve, and that location should be directly above the blanks you just filled up with data. Once you have these values in, you can extrapolate the remaining values and label each fuel curve as applicable. To get an idea what this looks like, look at some of the other samples provided.
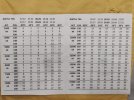
Now follow instruction 2. Determine ROP fuel burn from POH at % load shown. Plot known ROP Burns on graph. This may take a bit of extrapolation because your POH may not show the fuel burn for exactly 75%, 70%, 65%, 60%, 55%, 50%, and 45%. You may need to average two or three of them together to get the numbers you need. This is a "Nice to have" step not necessarily a "Need to have" step. Once you have the values from your POH, plot them on the graph with a dot placed on the % power line and the correct GPH curve. This will give you an idea what the designers were thinking when they wrote your POH.
Now follow instruction 3. Using your POH find the RPM and MP for a specific power setting. Calculate the MR number that goes along with it and label the Air Flow Curves accordingly. If your POH is written for a fixed pitch prop, there might not be any Manifold Pressures at all. Use the other samples to determine how they should be labeled.
Once all of the values have been filled in, fold the paper in half and you have a graph ready to use. I hope you find this chart useful. I use my chart on every flight.
If you have studied ROP and LOP operations, then you may be familiar with the Red Box and the Red Fin concepts. The Red Box, and the area under the Red Fin, is defined as an area of higher engine stress to be avoided if possible. It occurred to me some time ago that not only can the Red Fin be graphed but so can curves of constant fuel flow and curves of constant air flow be superimposed on the same graph. I was able to graph the curves for my 1964 Mooney M20E and I have been using them to set my mixture since 2019. In 2020 I expanded the graph to give me more information for use during light cruising at reduced power and speed. I use this graph every time I fly, to make sure I am getting the best economy out of the fuel I am using. It is easy to use and with my bird having a Fuel Flow Meter, Manifold Pressure Gauge and Tachometer it makes setting up the engine for LOP operations a snap.
I have finally figured out how to make this set of curves applicable to any airplane equipped with any engine. All you need is your POH, and calculator and a pencil. Start by printing a color copy of "Red Fin Fuel Air Curves Scales" This is a blank set of curves with some instructions underneath. Start by following instruction 1. Determine LOP fuel GPH values using FORMULA: ( Rated HP / 15 ) x ( % / 100) = GPH -50℉ LOP for each % of load calculated. Calculate the LOP GPH values and fill in the blank lines over 75%, 71.25%, 67.5%, 63.75%, 60%, 56.25%, 52.5%, 48.75%, and 45%. Now fill in those values to the corresponding fuel curve above. Notice the BLACK Fuel Curves are vertical at 75%, 60% and 45% on the graph. Notice the bottom of each fuel curve is displaced to the right at the bottom end. The value for each Fuel Flow curve should be directly below the bottom end of each curve, and that location should be directly above the blanks you just filled up with data. Once you have these values in, you can extrapolate the remaining values and label each fuel curve as applicable. To get an idea what this looks like, look at some of the other samples provided.
Now follow instruction 2. Determine ROP fuel burn from POH at % load shown. Plot known ROP Burns on graph. This may take a bit of extrapolation because your POH may not show the fuel burn for exactly 75%, 70%, 65%, 60%, 55%, 50%, and 45%. You may need to average two or three of them together to get the numbers you need. This is a "Nice to have" step not necessarily a "Need to have" step. Once you have the values from your POH, plot them on the graph with a dot placed on the % power line and the correct GPH curve. This will give you an idea what the designers were thinking when they wrote your POH.
Now follow instruction 3. Using your POH find the RPM and MP for a specific power setting. Calculate the MR number that goes along with it and label the Air Flow Curves accordingly. If your POH is written for a fixed pitch prop, there might not be any Manifold Pressures at all. Use the other samples to determine how they should be labeled.
Once all of the values have been filled in, fold the paper in half and you have a graph ready to use. I hope you find this chart useful. I use my chart on every flight.
Attachments
-
Red Fin Fuel Air Curves Scales 1-27-25.pdf413.9 KB · Views: 31
-
RFFA M20E IO-360 200 HP Lycoming.pdf610.7 KB · Views: 19
-
RFFA C-172-E O-300-D 145HP Continental.pdf632.5 KB · Views: 13
-
RFFA Cherokee 140 O-320 150HP Lycoming.pdf617.4 KB · Views: 11
-
RFFA Mooney M20C O-360 180HP Lycoming.pdf744.7 KB · Views: 7
Last edited: